DOE Case Study 2


Full factorial data analysis
By using the excel provided on BB, I fill in all the necessary data of this case study.


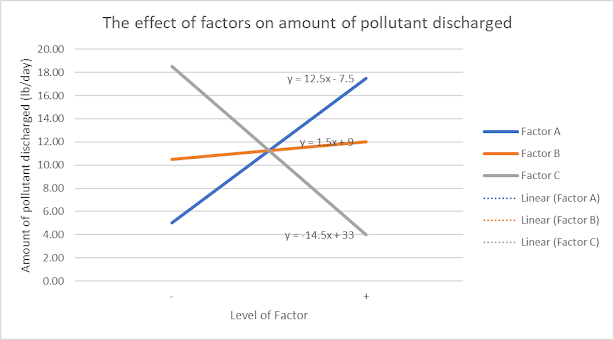
According to the graph, the ranking from the most significant to the least significant effect of factors on the amount of pollutant discharged is C > A/B> B/A.
When the concentration of coagulant added increases from 1% to 2%, the amount of pollutant discharged increases from the mean of 5 to 17.5.
When the treatment temperature increases from 72o to 100oF, the amount of pollutant discharged increases from the mean of 10.5 to 12.
When the string speed increases from 200 rpm to 400 rpm, the amount of pollutant discharged decreases from the mean of 18.5 to 4.
Analyze Interaction Between Factors


The gradient of both lines is different by a little margin. Therefore there’s an interaction between A and B, but the interaction is small.
Interaction effect between A×C:


Interaction effect between B×C:


Excel file: Onedrive
Fractional Data Analysis
Using orthogonal method to determine 4 runs from full factorial experiment data. All factors from these 4 runs are balanced on both low and high levels.
Next, I analyze the data using the graphical method.

According to the graph, the ranking from the most significant to the least significant effect of factors on the amount of pollutant discharged is C > A/B> B/A.
When the concentration of coagulant added increases from 1% to 2%, the amount of pollutant discharged increases from the mean of 2.5 to 8.5.
When the treatment temperature increases from 72o to 100oF, the amount of pollutant discharged decreases from the mean of 8.5 to 2.5.
When the string speed increases from 200 rpm to 400 rpm, the amount of pollutant discharged decreases from the mean of 9 to 2.
Excel: Onedrive
No comments:
Post a Comment